
Lab Automation and Informatics
How to Decrease Dry Lab Timelines for Faster Decision Making

Intro
It’s crazy to think about breakthroughs in research techniques on the bench. Technology like: dispensing at picoliter scale, the ability to program experiments remotely, 3D cell culture, and AI research tools mean we’re able to execute experiments using cutting edge tools with the hopes of discovering the next big therapy. Despite all of the flashy robotics and disease models, one bottleneck still causes headaches in lots of labs. Informatics, or the study of transforming data and information into knowledge, can still be slow and messy. This can lead to mistakes, confusion, and slow downs in the research process. Luckily, there are tools available to address some common bottlenecks we see in the lab. This blog post explores the inefficiencies of a typical data pipeline in research labs, outlines the features of an automated informatics system, emphasizes the importance of informatics, and presents a model of organized data management
The Typical Data Workflow
So, you’ve run your experiment and have some data on a plate reader. Now it needs to get off of the plate reader and on to a computer where it can be analyzed. Here’s what that informatics pipeline could look like:
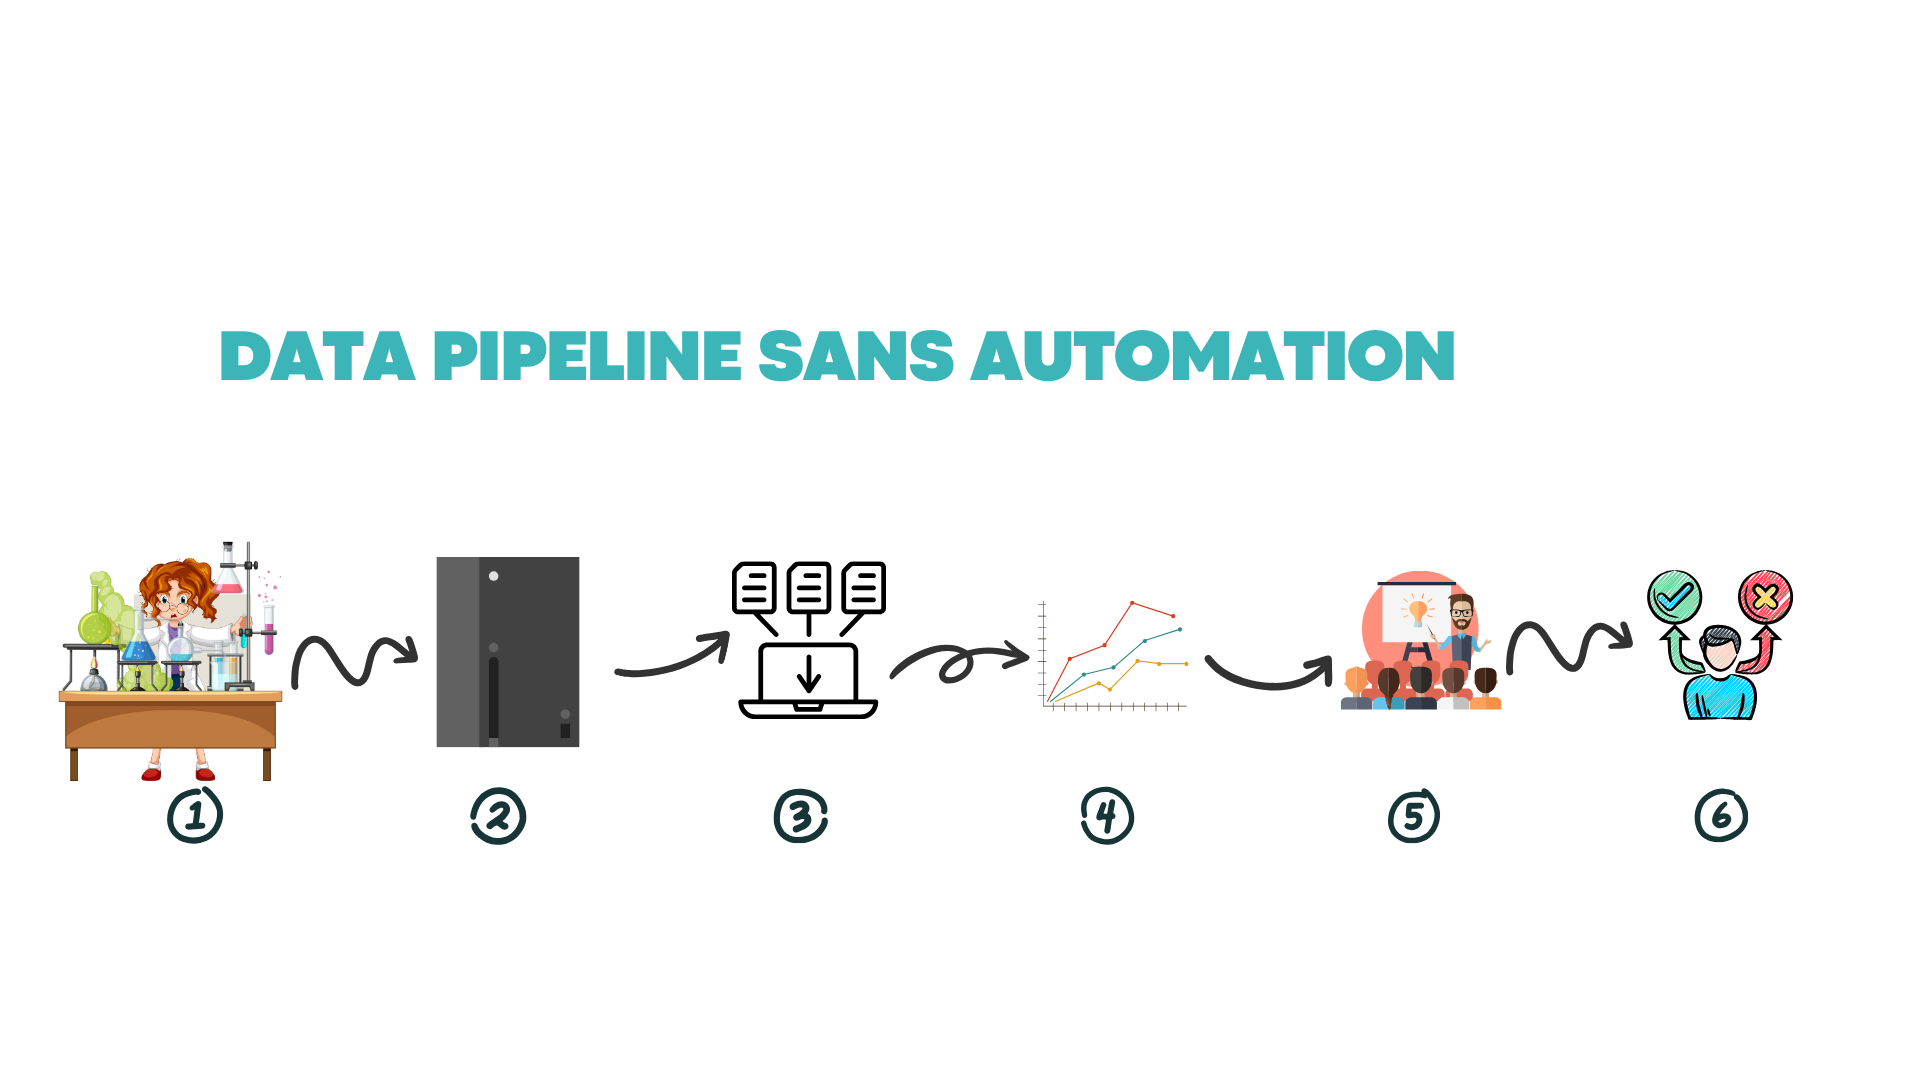
Execute Experiment
Read experiment on plate reader
Search for your data file on the plate reader software. Here’s a way to make sure you’re exporting the correct plate, especially for larger runs:
Number your plates with a marker and have a record of what samples are on that plate written somewhere.
If your plate reader has a stacker, you’re already ahead of the curve. Take a picture of your numbered plate stack to verify that your plates are being read in the right order.
Set up your protocol to take a time stamp of your read plate and include it in your output csv file.
Read your plates and rename them with the plate number based on the plate order and time stamp.
Export to a thumb drive
Bring it to your computer
Save the raw data files to your computer, which only you and IT can access.
Consolidate metadata containing your plate maps with sample and concentration information and raw data
Copy and paste or upload your CSV file into your data analysis software of choice. Analyze and visualize your data
Put visualized data into your a presentation or organize it into a pdf and send it off to whoever makes the decision
The decision maker looks at the data package, and may need to reference raw data for further calculations. In this case, they’d need to ask the scientist for their formatted data.
This might sound familiar and totally normal to you, but I’d like to point out some areas of … improvement and possible sources of error.
How do you verify that the plate you’re reading contains the correct samples throughout the workflow?
How much time are you taking on the reader’s computer searching for and exporting the data? What about other scientists that need to read their plates as well?
How secure is data on a thumb drive? What happens if it gets lost?
Is the data being uploaded into a place where others can find it?
How would others interpret the data if they only had the raw data file?
How are you sure that the copy and paste of your data is correct? What if you’re off by one cell on the sheet?
Are decision makers able to access the raw data or search all of the data they have ever been sent?
How much longer will it take to log this into an ELN?
What if more than one endpoint is needed to make a decision? Where is the other data?
Having observed this “behavior” in every lab I’ve worked in, I have to wonder why this isn’t seen as more of an issue. How many plate mixups go unnoticed before it’s too late? How much data is lost when a researcher leaves a company? How much delay is there when a researcher gets sick? Can a decision maker make sense of excel sheets with raw data if they need to reference it? How can they access the raw data? What’s the answer to these bottlenecks, and how much time is saved throughout an experimental workflow?
Here’s What’s Possible
What if I told you that with proper setup, most of your informatics workflow can be automated, leading to fewer mistakes, better security, and less time doing the dry lab portion of your workflow?
Let’s talk about the setup:
Establish a barcoding system for your samples and assay plates.
Setup ELN templates that contain protocol details and experiment metadata: sample and concentration plate maps.
Work with IT to create a data storage system in the cloud and link your computer’s storage system with it.
Work with a vendor or automation engineer to automate data export: upload data directly to the cloud from a plate reader in a set location.
Work with vendors to build integrations to export data from the cloud and ELN into your data management system for analysis and storage.
Now, the improved informatics workflow:
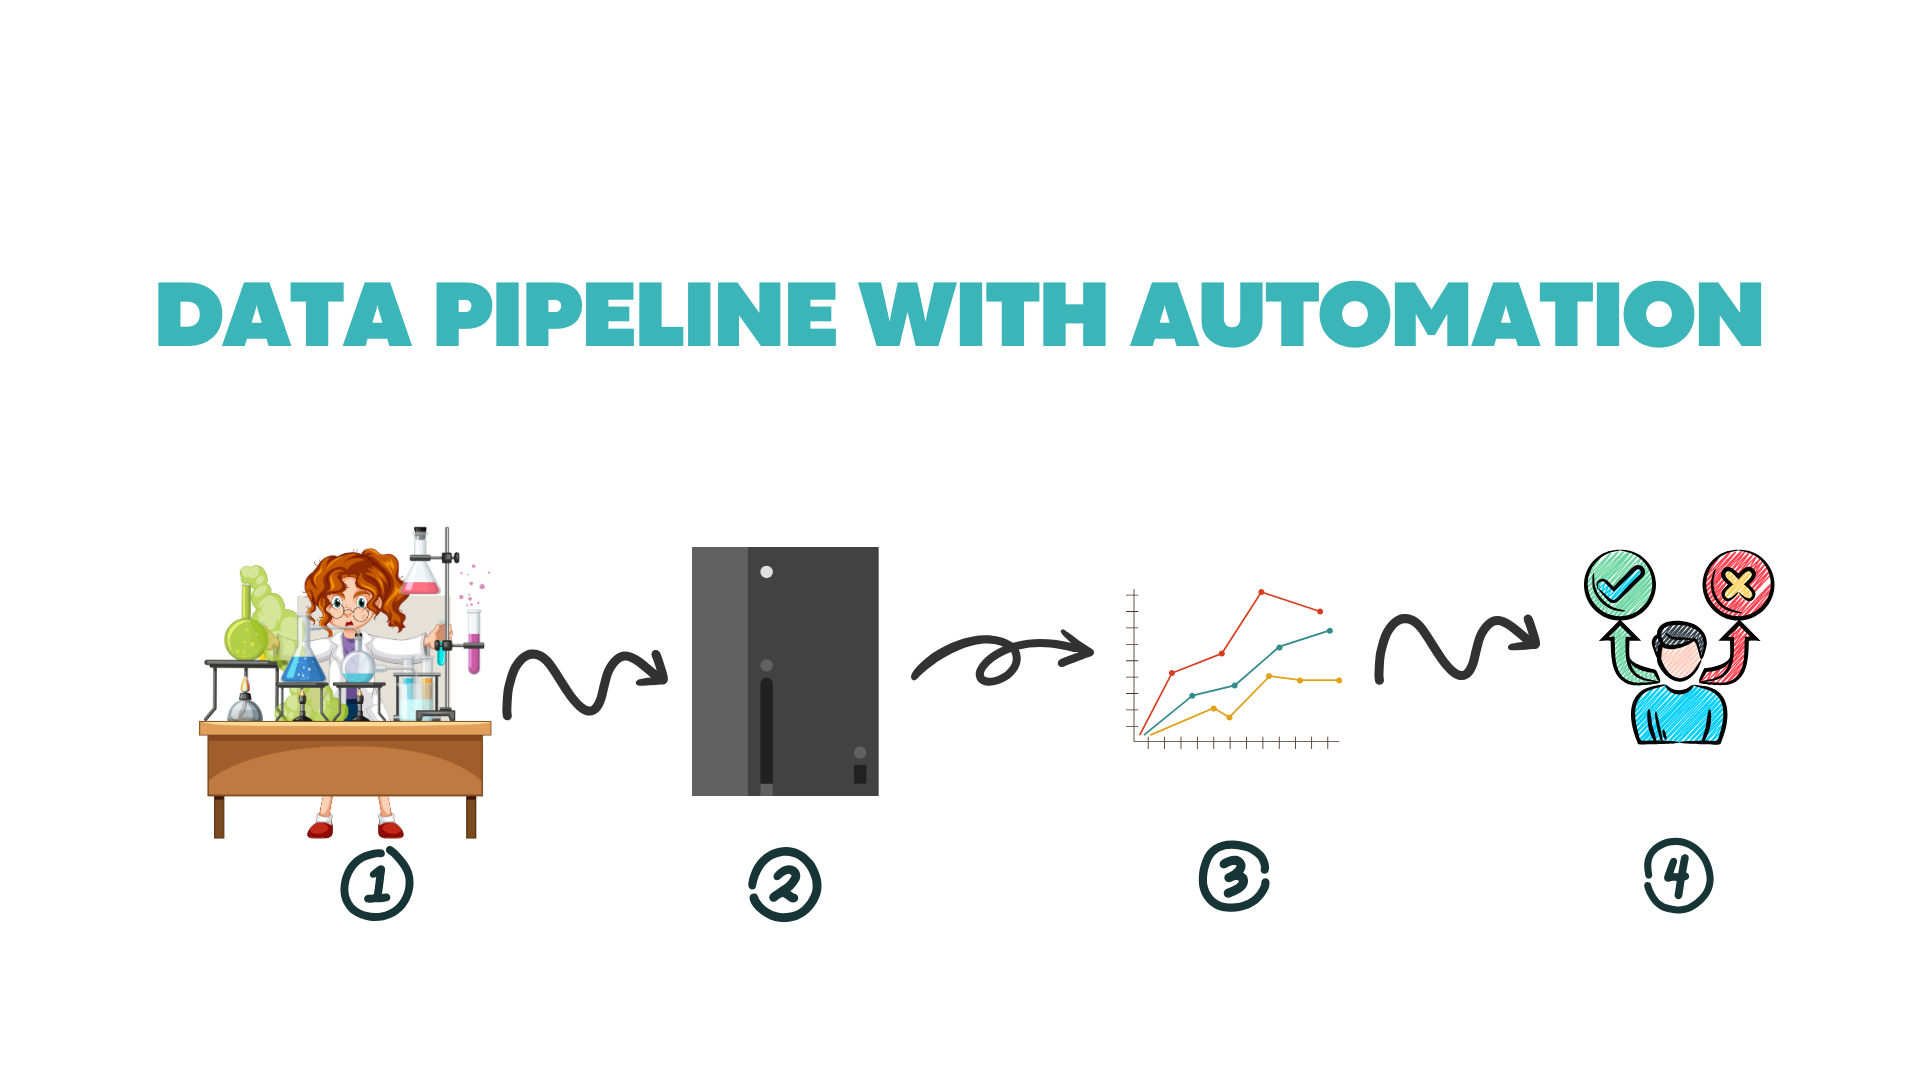
Execute experiment
Barcoded assay plates are loaded into your plate reader that has a built-in scanner. The order you load your plates doesn’t matter.
Your plate is read and data is exported to the cloud with the plate barcode as the file name.
Raw data is sent to the ELN where the metadata and raw data are combined into structured data. Matching barcodes are used to consolidate metadata and raw data.
This structured data is sent off to the data management system for analysis.
A report is generated to put into a presentation or send in an email, but the data management system is the source of truth.
Decision maker is able to access data in LIMS, this includes structured raw data, which can be used to perform correlation analysis with other assays
*Data management and LIMS can either be the same software or be separate. In this example, the LIMS system has a data analysis component.
The only work the researcher needs to do is load the plates into the instrument and dispose of them. The automated informatics handles everything else. A researcher can QC their data and remove outliers, but that can also be automated.
Why is Informatics Important in Research?

The examples I detailed were for one assay, but for something like drug discovery, multiple assays are required to make a decision. If the people making the decisions are not the people running the experiment there needs to be a centralized system where all of this information can be searched, displayed, and interpreted.
The problems with PDFs, excel sheets, and slide decks is that they’re not searchable and the nomenclature is likely not standardized. Here’s how an automated data pipeline can lead to faster decisions using small molecule data as an example:
ADMET involves at least 5 assays worth of data to make a decision on a molecule.
A decision maker should be able to search a LIMS system by molecule and access all associated data.
Taking this a step further, all 5 readouts for the assays can be visualized at once for the full picture.
Further analyses can be run to find the correlation between assays oftentimes in the same system where the data is being visualized.
This is how a data management system could look. I’d just like to preface, I’m not a UI designer or a chemist, plus the program I used to make the curves could only do so with really steep hillslopes. Look at this figure more for its elements rather than its actual content!
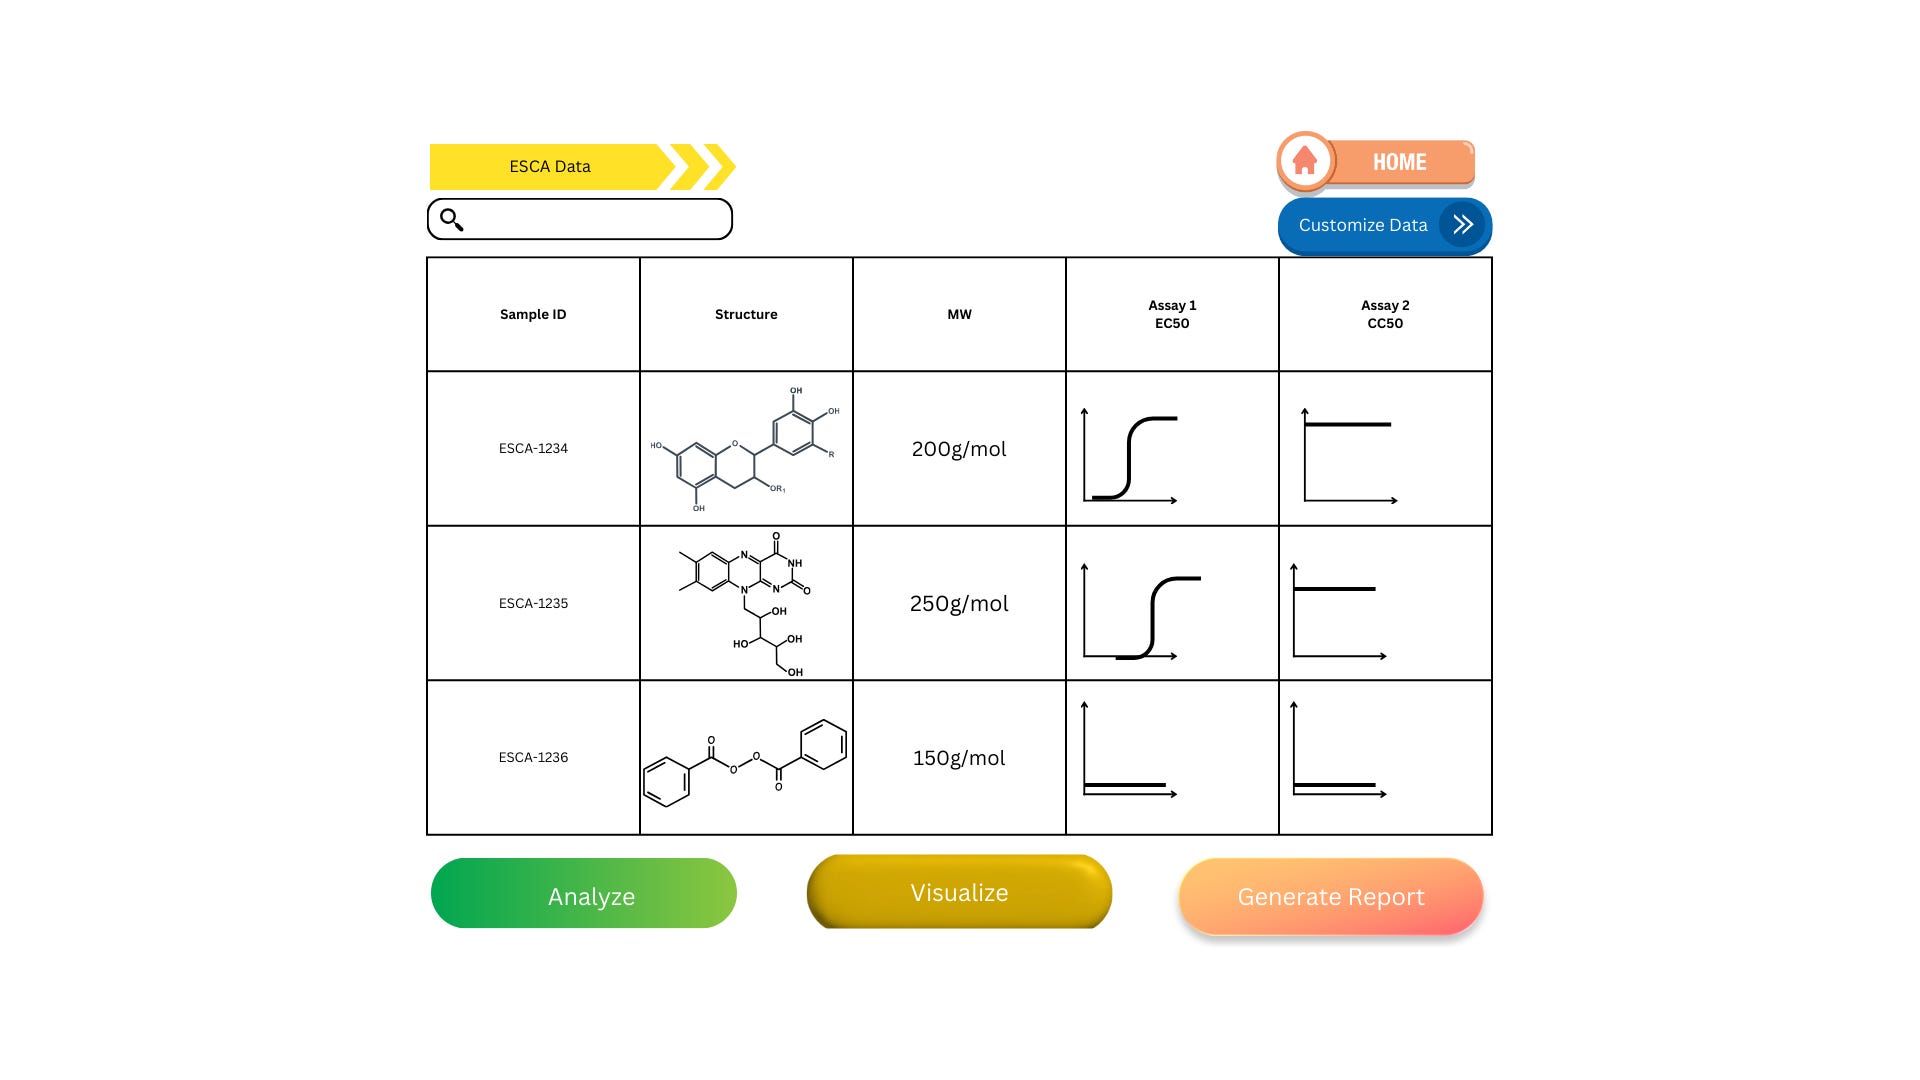
This is a simpler example, where we’re only looking at the structure, sample ID, molecular weight, and two assay measurements: efficacy and toxicity. Just by looking at this, we can already rule out ESCA-1236, whose lack of compound activity is likely due to compound toxicity in this assay. If you want further proof to validate this decision, simply click the “customize data” button to add another assay measurement. From here, you can run further analysis to compare the two remaining compounds, visualize the correlation, and generate a pdf or csv to send off for other researchers to see.
Notice how you didn’t have to ask anyone for data. With a system like this all data is at your fingertips structured and ready to go. I’m basing this heavily on a LIMS system I used, CDD Vault, which was an awesome tool to have access to. Being able to visualize all of this and more gave me insight into what’s possible in the lab. Even though we had this tool available, most of the company wasn’t using it!
I’ve been in projects where a data scientist is trying to make sense of a biologist’s csv file. It takes time to sit down and establish that line of communication just to locate relevant files. Automating an informatics workflow reduces lines of communication and saves time leading to quicker decision making.
Considerations for establishing an automated informatics workflow:
Establishing an automated informatics workflow works best for routine screening.
The efforts to establish informatics for one-off experiments may take longer than the experiment itself
The workflow needs to be user friendly
Change will be hard to implement if your average biologist has a hard time using the system. This goes for anything automated.
Establishing an informatics workflow requires collaboration
Software engineers for integration, vendors for software, data scientists to validate analysis workflows, IT for curation of cloud storage and data security, scientists for protocol input, automation engineers to script robotics and setup plate reader protocols.
While a system like this can come with a hefty price tag, more money is saved with the time saved by automating. Augment the value of scientists by reducing wet and dry lab timelines so they can focus on science and research. This is the core of automation’s value.
Conclusion
Data needs organization to be effective. With an automated informatics system in place, scientists can focus more on interpreting their data and planning better experiments instead of searching for, exporting, analyzing, visualizing, and organizing their data. You’ll also see value in reducing lines of communication between scientists and decision makers. In this blog, I described a typical data pipeline, why it’s not efficient, and what an automated informatics system looks like; furthermore, I talked about why informatics is important and created a mock up of organized informatics.
Let me know what you think of my visuals!