Considerations for High Content Imaging in Automation

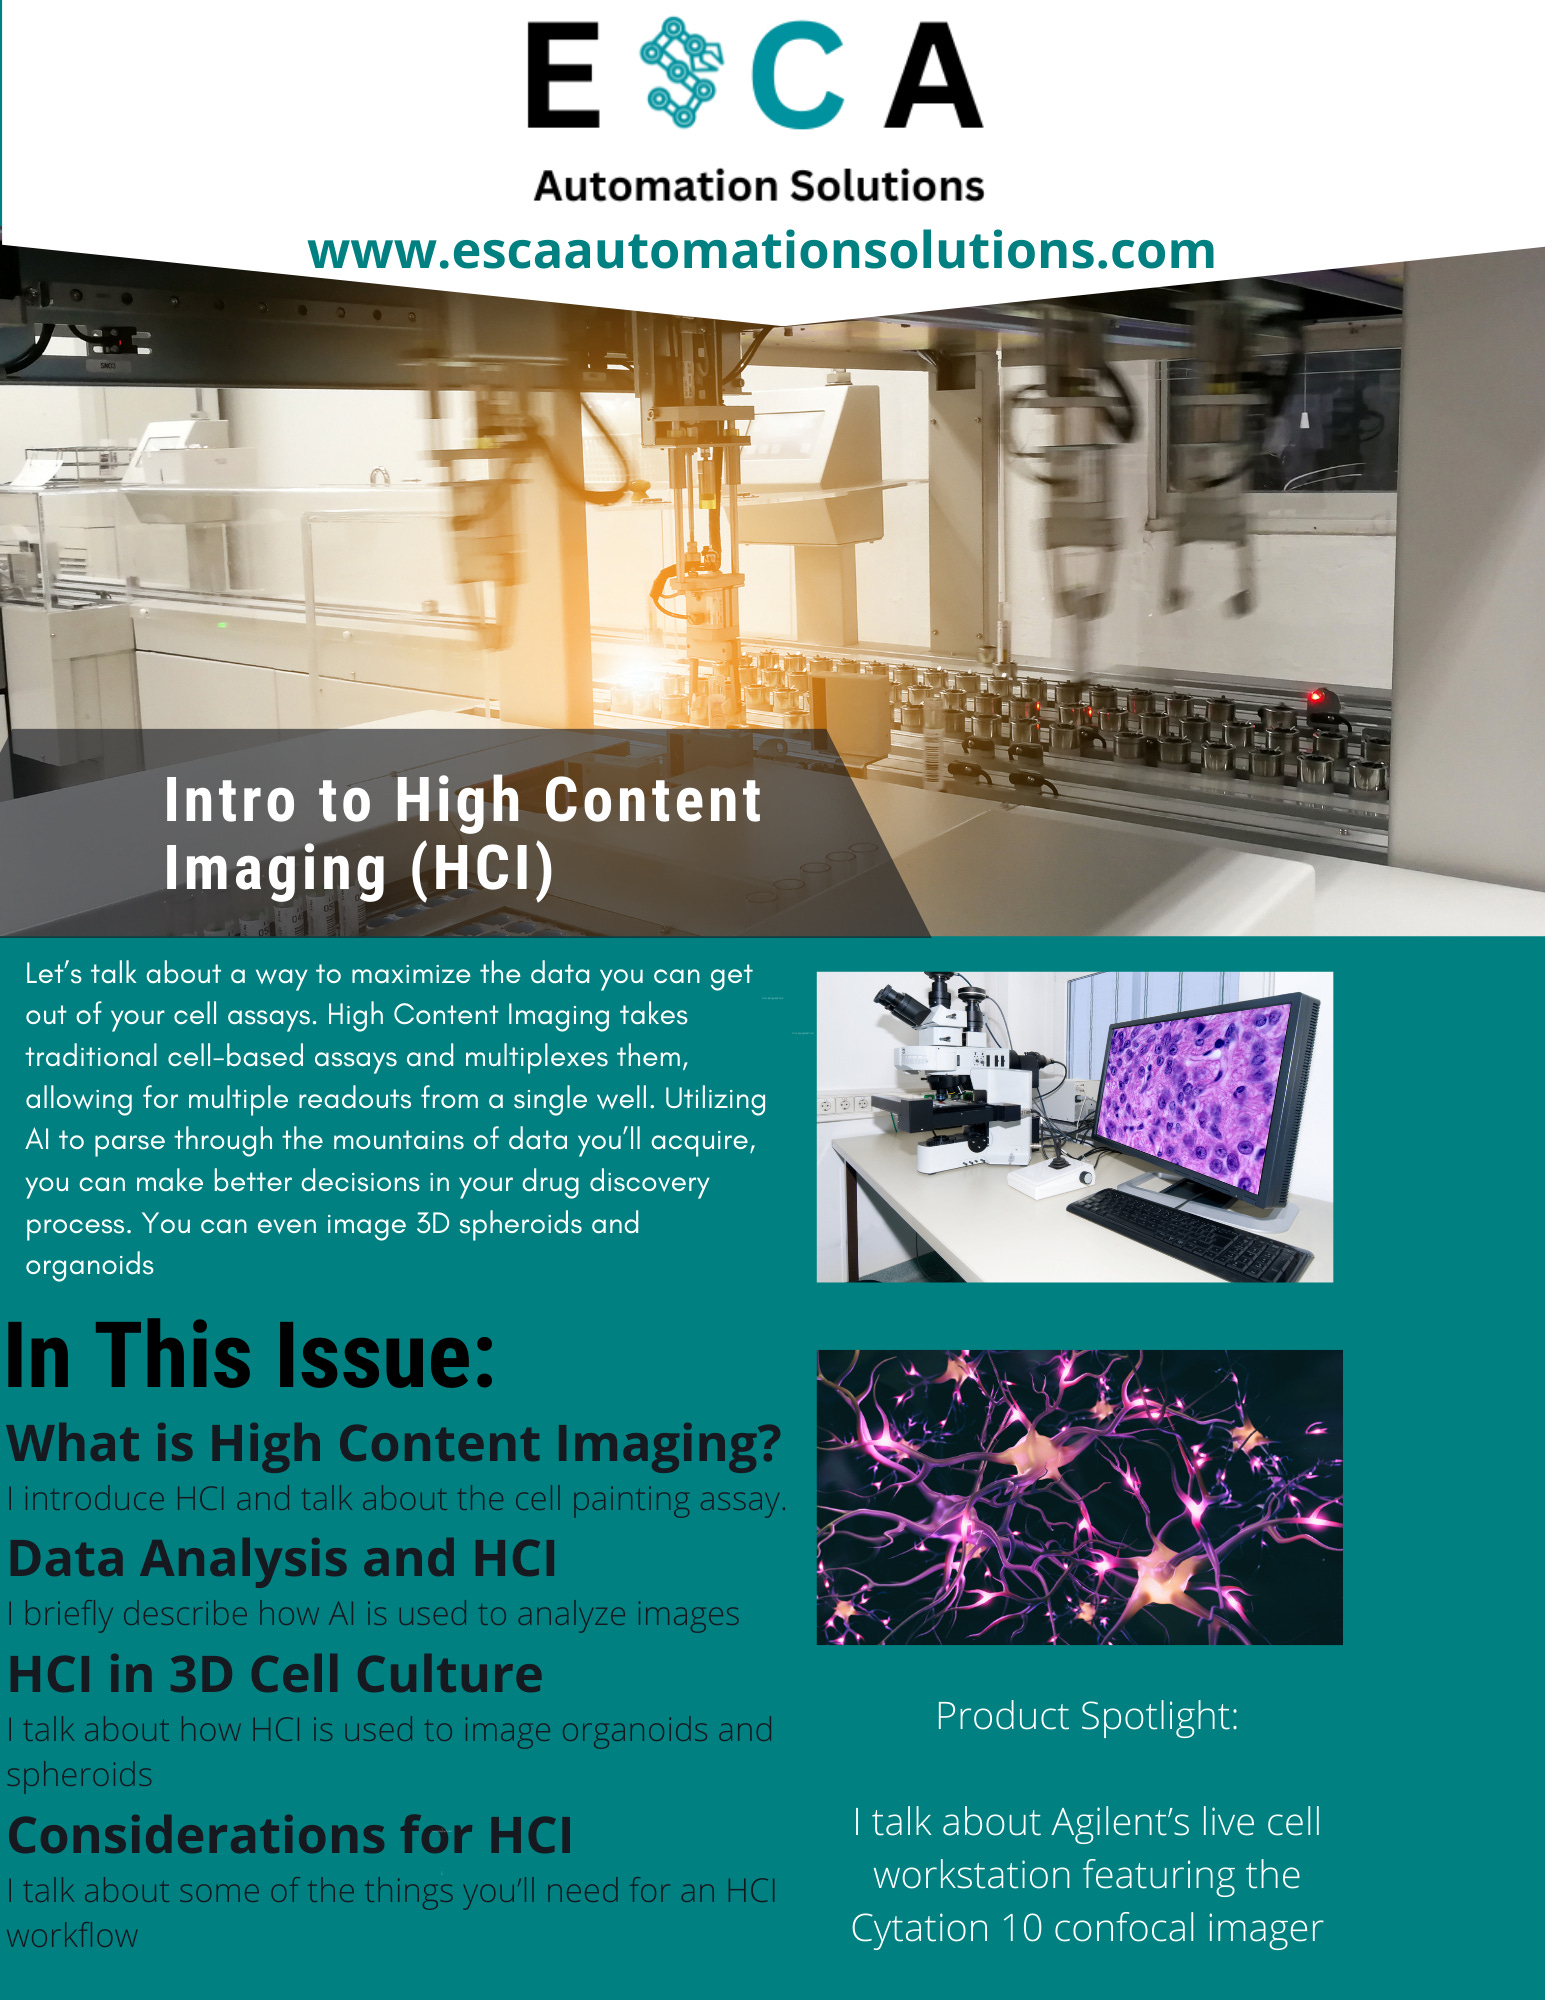
Intro
I touched on imaging readouts in a previous post, but they can be used to measure a single endpoint in traditional cell based assays. Part of the protocol to prepare cells for imaging is the addition of paraformaldehyde(pfa) to preserve the cells, but this also kills the cells and prevents any further information from being gained beyond the endpoint. High Content Imaging(HCI), however, is a way to go from an assay with a single endpoint to a multiplexed assay. This opens up the potential of data you can gather from a single plate. In this post, I’ll explain some basics of high content imaging, how AI is used to generate data from images, talk about its applications with 3D cell culture, and I’ll talk about considerations when bringing HCI into your 3D cell culture workflows. Additionally, I’ll talk about an imaging workcell from Agilent.
What is High Content Imaging?

HCI involves the use of fluorescent dyes to stain multiple features of a cell and track the changes from exogenous treatments using high powered microscopy. As opposed to an assay with a single endpoint, like a CTG assay that detects the death phenotype by measuring ATP, HCI can track multiple morphological changes at a single or track something like neurite outgrowth over time. HCI is most useful when:
A single feature is not sufficient to define a phenotype
A feature is not easily defined or quantified, like the qualitative difference between a perturbed(unhealthy) or unperturbed(healthy) organelle
A notable assay that multiplexes multiple dyes in a single well is called the Cell Painting assay. Lets break down each of the six dyes and what they can track:
Mitotracker stains the mitochondria
Wheat germ agglutinin/Alexa Fluor 555 conjugate stains the plasma membrane
Phalloidin/Alexa Fluor 568 stains F-Actin
Concavalin/Alexa fluor 488 conjugate stains the ER and Golgi
Syto 14 green fluorescent acid stain stains the nucleus and cytoplasm
Hoechst 33342 more specifically stains the nucleus and is less toxic compared to Syto 14 suggesting a potential use in live-cell assays
This protocol works with many different cell types, so it can be used across many indications. While most of these stains do require the use of pfa to fix the cells, the stains give you enough data for 6 different assays, and that’s just in 2D culture.
I’ve used Hoechst dye with a GFP expressing virus to count cells using the Hoechst stain and calculate percent infection by dividing the number of green cells (infected) by the total number of cells (blue). The analysis software I used on my imager used ML to determine the position of the cell membrane and count the number of total cells. Whether your assay is using only two fluorescent channels, like mine, or 6 dyes like the cell painting protocol mentioned above, you’re going to need a lot of data management and informatics to make sense of the data.
Let’s talk about why data science and AI are important when parsing data sets acquired from high content imaging.
Data Analysis and HCI
HCI involves taking multiple measurements per well of your cell plate, whether that’s looking at the entire monolayer or sub populations of cells within a well. When working in medium throughput, testing a few hundred to a few thousand treatments, that is considered high content analysis(HCA). When testing in the tens to hundreds of thousands range, that’s called high content screening(HCS).
The amount of data points you can get per cell from HCI can “be in the thousands for highly multiplexed assays.”(Markossian et al). That comes from the HCI portion of the assay guidance manual, a collaborative document funded by the NIH. Taking all of these measurements creates a large data burden, so you’ll need tons of storage for a single plate, let alone a whole screen; furthermore, the analysis isn’t feasible for a scientist to do manually due to the volume of data acquired. For context, imaging data from a single channel for a 384 well plate is about 1.1GB (uncompressed). For something like a cell painting assay, mentioned above, that measures in 5 channels, that’s 5.5GB for one plate at minimum. HCS requires data repositories of 50-100TB!
This is where automation, AI, and machine learning come into play. The role of AI when it comes to these large data sets is to learn how to quantify qualitative perturbations and combine the different measurements into an endpoint to help make decisions in a drug discovery effort.
As someone who is not a data scientist, I’ll do my best to explain the technical aspects of this type of informatics. Recall that ML is a subset of AI that combines separate elements to generate a metric. In HCI, the concept of Supervised Learning(SL) is applied. This assumes that there is a set definition of the perturbed and unperturbed states. This could be from public data sets from organizations like the BBBC or IDR or from your own internal images. Remember, there is a data quality problem in public datasets that can hinder your ML training, so use with discretion.
The ML algorithm learns what your positive and negative controls are from the training datasets to create a metric for each feature that is measured. Then, the algorithm looks at images from an assay and scores them based on this metric. This will provide a quantifiable measurement that will tell you the degree to which your treatment has caused a perturbation or not. For tracking more subtle perturbations, measuring many cellular features need to be considered for a robust screen.
Let’s take this a bit further and discuss HCI in 3D Cell Culture
HCI in 3D cell culture
You know how I said I’m not a data scientist? Well, I’m also not an artist, but to mitigate any copyright issues, I’ve drawn my own figure as seen below.
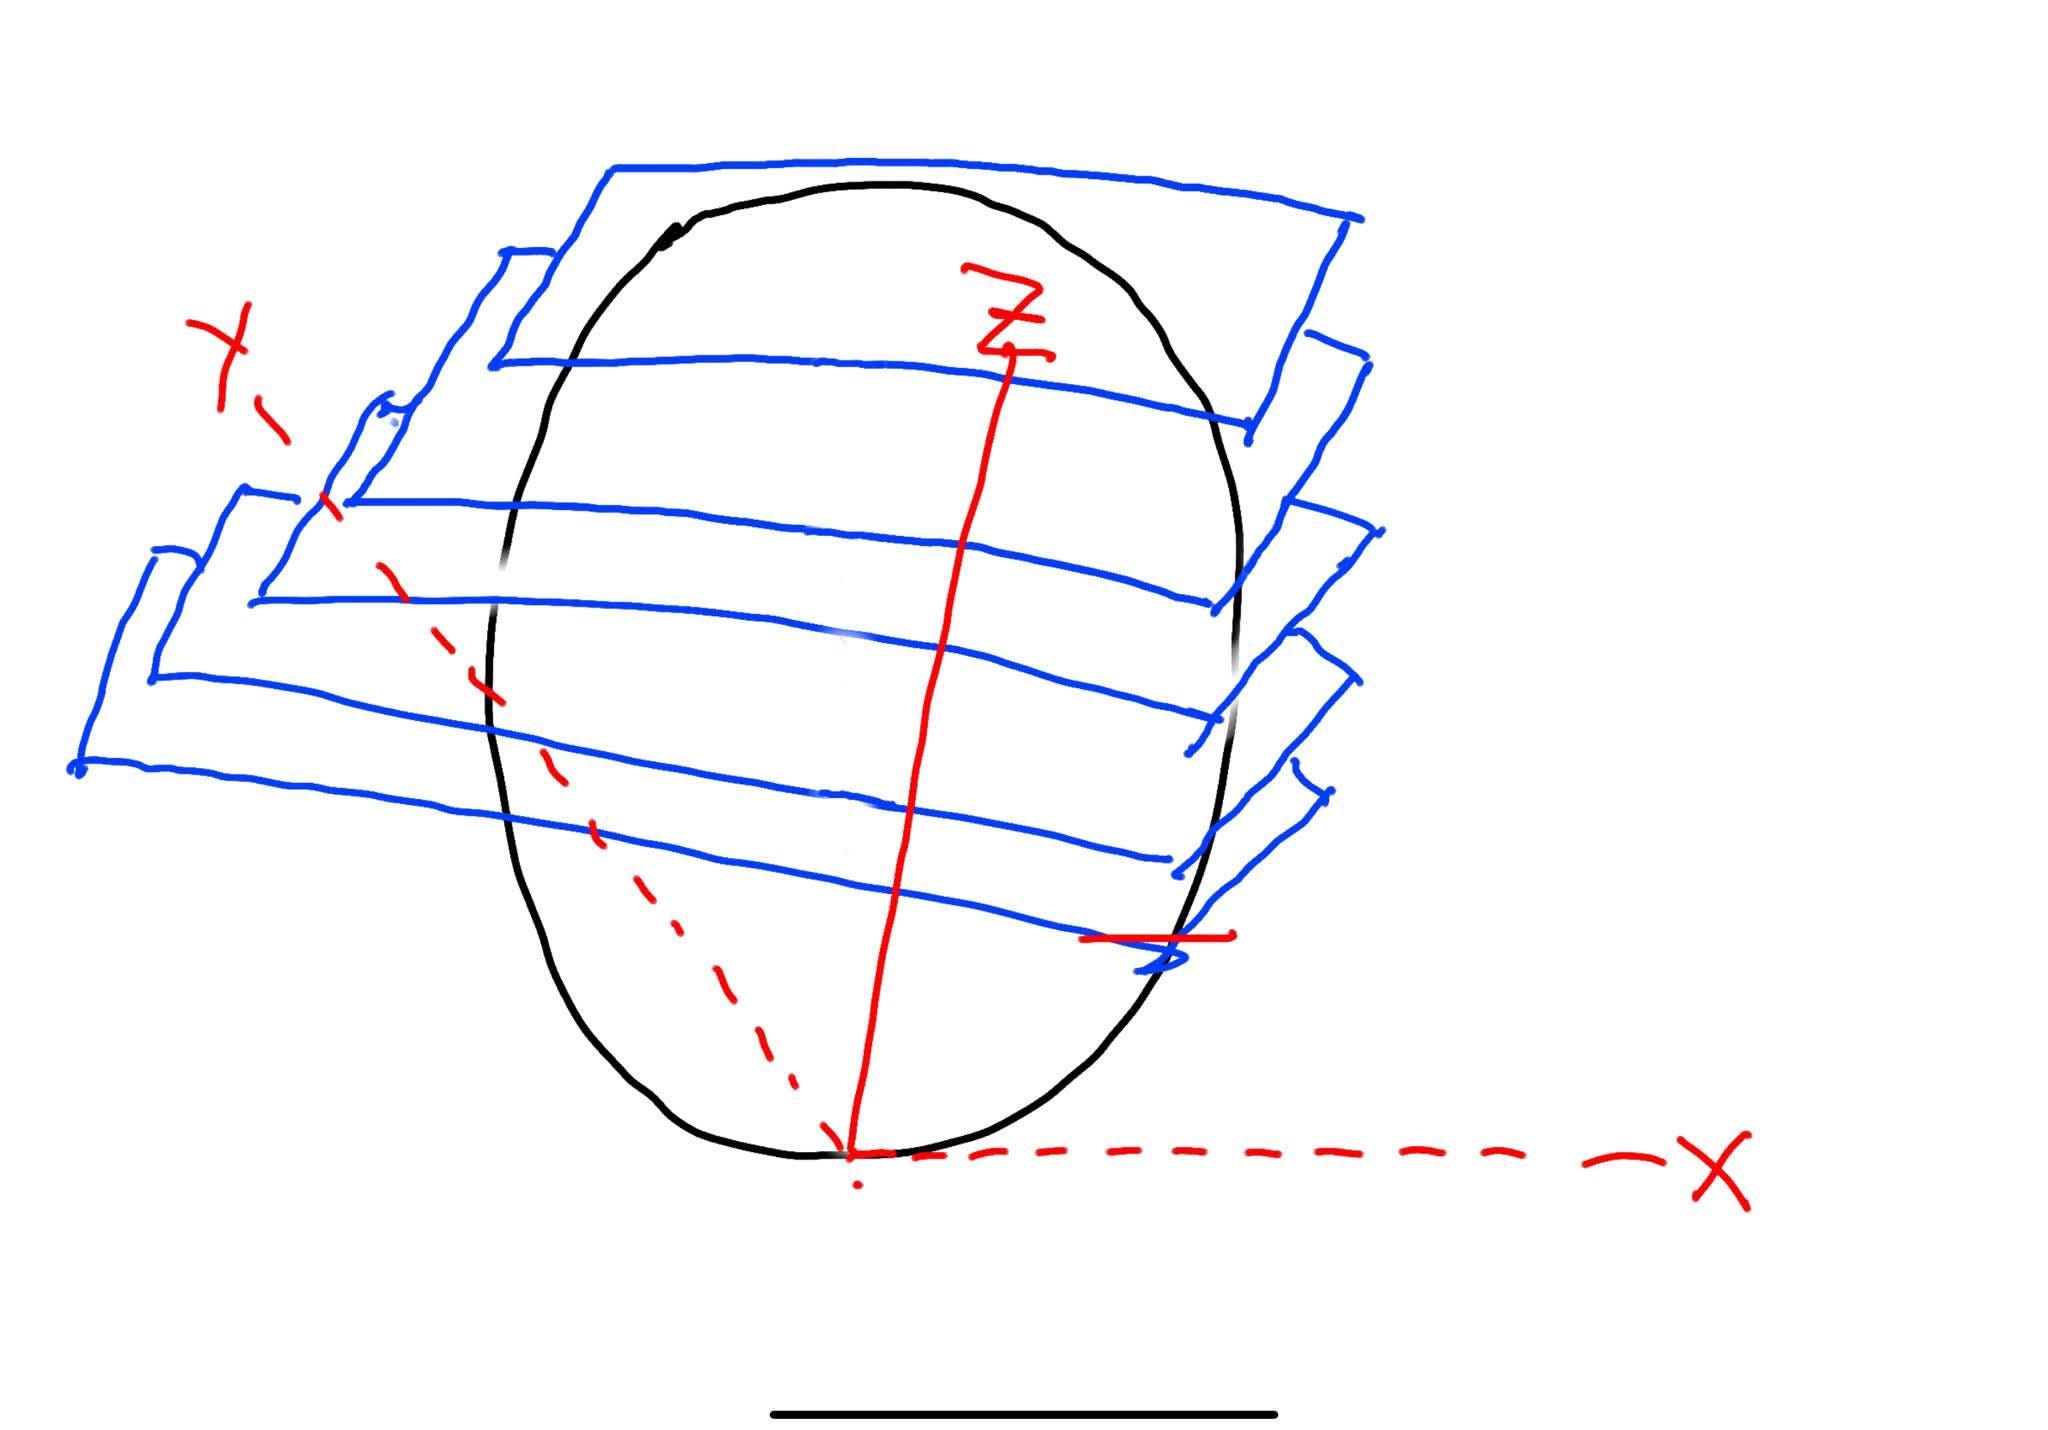
3D cultures can be better models of disease than 2D cells because they can mimic the cell-cell in the human body. When doing imaging of 3D cultures, you need to image Z-stacks (blue) which are then combined to image the whole 3D structure. This is possible because of confocal microscopy. Confocal microscopy uses a laser and pinhole for more intense light that can penetrate a 3D culture while blocking out other light. Each blue Z-stack in my masterpiece is about 5-10um apart and confocal microscopy measures the cell from the bottom up. Here are some considerations when imaging 3D cultures:
The data burden is higher since the Z stack takes multiple images per organoid/spheroid.
Dyes and reagents are less permeable, making staining and processing your spheroid/organoid take much longer.
Spheroids are harder to image than organoids because they are typically denser and don’t have a lumen like organoids do.
With the more complex, clinically-relevant cell models, you can gather data that reflects the human body more accurately than traditional 2D in vitro models. An example of this is using HCI to track the effect of treatment on contractile heart organoids. In this study, videos of heart organoids were taken, converted to tiff images, and fractional area changes were measured to determine bpm and contraction amplitude. Check out this video of a beating heart organoid:
I think this is such a cool space, and I anticipate cutting edge disease models and image analysis will become a vital tool in drug discovery. Take a listen to this podcast for an in depth look at 3D cell culture and HCI. Let’s talk about some considerations for high content imaging and if it would be useful in your lab.
Considerations for HCI
So, now that you have an idea of what high content imaging can do, what do you need to get it up and running in your lab?
Confocal imager, like the Cytation 10 from Agilent which allows imaging of 3D cultures
A data repository that fits your needs and is maintained. For HCS, consider 50-100 tb of data storage that is cleaned out between runs.
Image analysis software and personnel that can acquire, adjust, threshold, identify, select, and extract features from your images. Some free software includes ImageJ and Cellprofiler.
Software and personnel for data analysis: Free tools like R and matplotlib, or proprietary software like Spotfire can take data extracted from images and visualize it to help make decisions for drug discovery.
Consider using HCI when you’ve narrowed down your top hits, like in lead optimization, to minimize the timing and data burden of an high content imaging assay.
Oftentimes, purchasing an imager like the Cytation 10 comes with support from the vendor to set up your HCI workstation. This can include recommended reagents for your assay, protocols, and analysis software. Let’s talk more about the Cytation 10 and a workcell from Agilent that incorporates it.
Cytation 10 Workcell
The Multiflo, Cytation 10, and new Biospa can be combined to create a live cell imaging workcell. With the Multiflo, you can seed cells or add dyes which can then be imaged or incubated without you having to move the plate manually. This is best for live cell imaging to track the change of a perturbation over time or to maximize efficiency for incubation steps. The robotic arm takes your freshly stained or seeded plate, moves it into the Biospa automated incubator, then moves it into the Cytation for a reading.This is perfect for something like tracking neurite growth as I had mentioned before. With an all in one workcell like this, you can run studies remotely once the assay is set up. With scheduling software, you can add your dyes, leave while the plate is incubating, and it will get read without you having to press a button.
I’ve used a similar workcell to track the spread of a GFP virus to optimize MOI in assay development. Using a less toxic stain like DAPI or an imaging technique like digital phase contrast, I was able to image my plate every few hours and obtain % infectivity without having to add pfa to fix my cells. I was able to get two readouts per reading, total cell count and infected cell count, and I was able to use the same plate for the entire study with the attached automated incubator. Data from one plate helped me make a decision for the optimal MOI and time course for my assay.
Check out this video for greater detail about the Cytation 10 imager and more on confocal microscopy featuring a much better visualization of Z-stacks:
Conclusion
High Content Imaging is a way to get a wide breadth of data from fewer samples. Despite the high price tag of confocal imagers, consider the money saved over time by multiplexing assays. In this post, I explained the basics of high content imaging and how AI is used to generate data from images. I also discussed its applications with 3D cell culture, considerations when bringing HCI into your 3D cell culture workflows, and provided a look at Agilent's live cell workstation.